I have explained before what the heck is an Azure Stream Analytics job, so let’s focus on how to make the best out of it.
There are a million things you can do with Azure IoT but I guess that most scenarios look like that:
batch-input -> Azure IoT Hub -> multiple outputsCreating one Stream Analytics Job per output might be tempting, even if they share the same input. This will butcher your budget and you can easily avoid it! The trick I use is that I use a WITH-statement in my query, to use multiple outputs for the same input, as well as autoscale my Stream Analytics Job.
The query can look something like that:
WITH Input AS (
    SELECT
        *
    FROM
        [iot-hub-input] as Input TIMESTAMP BY Input.EventProcessedUtcTime
)

SELECT
    Input.Field1 as field1
    ,Input.Field2 as field2
    ,Input.Field3 as field3
INTO
    [postgresql-output1]
FROM
    Input
WHERE
    Input.Source = 'sensor1'

SELECT
    Input.Field1 as field1
    ,Input.Field2 as field2
    ,Input.Field3 as field3
INTO
    [postgresql-output2]
FROM
    Input
WHERE
    Input.Source = 'sensor2'
As you can see, I have two SELECT-statements, sending to 2 different outputs but only touching the IoT-hub once (in the WITH-statement at the top). This ensures that we don’t abuse our access to the Azure IoT Hub leading to bottlenecks and performance issues, while we still canalize traffic to multiple outputs.
In my real-life scenario, I have millions of incoming events and 14 outputs. I manage all this in one single Stream Analytics Job (1/3 Processing Unit with Autoscale). How does it feel? Quite OK actually:

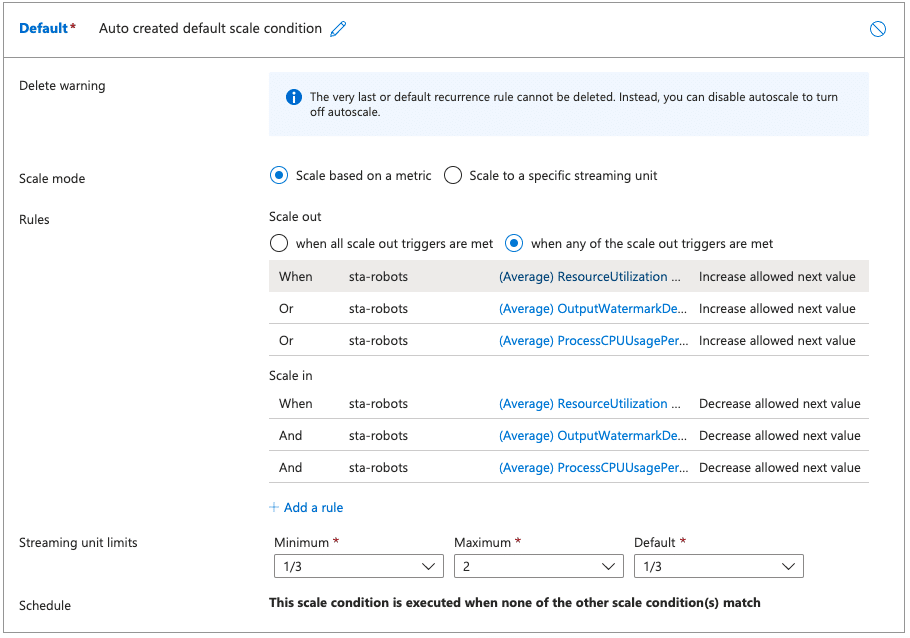
Now regarding autoscaling, or as I like to call it, when shit hits the fan, luckily the Azure Stream Analytics jobs have a fantastic autoscale-mechanism based on metrics, this is how I have configured mine:

This reads, if:
- CPU usage is > 80% for at least 10 minutes
OR - Watermark delay gets > 1 minute for at least 10 minutes
OR - Memory usage is > 80% for at least 10 minutes
Then increase the Processing Units by 1/3 until you reach 2.
If:
- CPU usage is <= 80% for at least 5 minutes
AND - Watermark delay gets <= 1 minute for at least 5 minutes
AND - Memory usage is <= 80% for at least 5 minutes
Then decrease the Processing Units by 1/3 until you reach 1/3.
Observe that scaling PUs goes like that
1/3 -> 2/3 -> 1 -> 2Obviously, the more PUs, the more expensive it gets. But I need it so seldom that it’s never an issue.
If you’ve read this long, then I truly hope that you found this post useful and that it helps you configure your IoT project effectively.
The main image of this post was created by DALL-E
